


Abstract
This study evaluated how different approaches to limiting energy availability (LEA) by 15% affected mammalian target of rapamycin (mTOR)-related signaling in mammary carcinomas. Female Sprague Dawley rats, injected with 50mg 1-methyl-1-nitrosourea per kilogram body weight, were randomized to a control or three LEA interventions: (i) sedentary and restricted rats fed to 85% of energy available to the control or motorized wheel running (37 m/min) for an average of (ii) 1621±55 (WRL) or (iii) 3094±126 (WRH) meters/day with food intake adjusted to provide the same net amount of available energy across LEA interventions. Under these conditions, LEA reduced overall cancer burden by 28% ( P = 0.04) and down-regulated mTOR-related signaling (Hotelling multivariate, P = 0.002). Among the regulatory nodes assessed, reduced levels of activated protein kinase B (pAkt) and induction of sirtuin 1 (SIRT1) were the most influential factors in distinguishing between sham control and LEA carcinomas. P-Akt was predictive of observed changes in levels of proteins involved in cell cycle control ( r = 0.698, P < 0.0001) and induction of apoptosis ( r = –0.429, P = 0.014). Plasma insulin and leptin were strongly associated with carcinoma pAkt levels. Consistent with downregulation of mTOR-related signaling by LEA, evidence of decreased lipid synthesis in carcinomas was observed (Hotelling multivariate, P < 0.001) and was negatively correlated with SIRT1 induction. Despite large differences between control and LEA, effects on mTOR regulation were insufficient to distinguish among LEA intervention groups. Given the modest effects observed on the LKB1/AMP-activated protein kinase regulatory node, NADH and NADPH rather than ATP may be more limiting for tumor growth when LEA is 15%.
Introduction
Previous work has shown that limiting energy availability(LEA) to an organism by either reducing caloric intake or increasing energy expenditure via physical activity inhibits chemically induced mammary carcinogenesis ( 1–3 ). Of the various aspects of the carcinogenic response affected, these interventions markedly decrease tumor burden. An understanding of the mechanisms by which reduced caloric intake or increased physical activity affect tumor growth is important to determining how best to use these intervention strategies in both cancer prevention and cancer control.
There are many avenues through which reduced caloric intake and increased physical activity could be exerting anticancer effects and inhibition of the activity of the mammalian target of rapamycin (mTOR) appears to play a role ( 4–8 ). Thus, the work reported focused on cell signaling pathways associated with mTOR activation ( 9 , 10) . This network is deregulated in the majority of human breast cancers making this study translationally relevant ( 9–12 ). Since it is unclear whether the relationship between an individual’s level of caloric intake and physical activity has any consequence when the overall level of LEA is modest and held constant, the objectives of the experiments reported herein were as follows: (i) to determine whether mTOR-related signaling in mammary carcinomas is affected by LEA, (ii) to assess whether regulatory nodes in the mTOR network were modulated differentially when the overall level of LEA was held constant, but manipulated by varying caloric intake and physical activity and (iii) to identify plasma analytes associated with changes in mTOR pathway regulation as affected by LEA. Advanced multivariate regression techniques were applied to carcinoma western blot data and enzyme-linked immunosorbent assay (ELISA)-determined concentrations of plasma analytes to provide an unbiased approach to data interrogation.
Materials and methods
Chemicals
Primary antibodies used in this study were anti-cyclin D1 and anti-p27 Kip1 from Thermo Fisher Scientific (Fremont, CA); anti-Bax and anti-Bcl 2 from BD Biosciences (San Diego, CA); anti-GADD153 from Novus Biologicals (Littleton, CO); anti-pLKB Ser428 /LKB, anti-pAMPK Thr172 /AMPK, anti-FOXO Thr24/Thr32 /FOXO, anti-SIRT1, anti-PI3Kp110, anti-pAkt Ser473 /Akt, anti-TORC1, anti-pmTOR Ser2448 /mTOR, anti-pP70S6K Thr389 /P70S6K, anti-p4EBP1 Thr37/46 /4EBP1, anti-p-Raptor Ser792 /Raptor, anti-pPRAS40 Thr246 /PRAS40, anti-pACC Ser79/ACC, anti-FASN, anti-rabbit immunoglobulin–horseradish peroxidase-conjugated secondary antibody and LumiGLO reagent with peroxide were purchased from Cell Signaling Technology (Beverly, MA); anti-SCD1, anti-HMGCR, anti-SREBP1 and anti-mouse immunoglobulin–horseradish peroxidase-conjugated secondary antibody were from Santa Cruz (Santa Cruz, CA); mouse anti-β-actin primary antibody was obtained from Sigma–Aldrich (St Louis, MO). Carcinogen: 1-methyl-1-nitrosourea was obtained (Ash Stevens, Detroit, MI) and stored at –80ºC prior to use. Glucose-hexokinase liquid stable reagent (Thermo Fisher Scientific, Waltham, MA); ELISA kit of C-reactive protein (Helica Biosystems, Fullerton, CA); multiplex and signalplex kits for insulin, leptin, interleukin-6 and tumor necrosis factor-alpha and insulin-like growth factor 1 as well as ELISA kit of adiponectin (Millipore, Billerica, MA); insulin-like growth factor binding protein 3 ELISA kit (Mediagnost, Reutlingen, Germany); commercial ELISA kits of serum amyloid P, 17-beta-estradiol and progesterone (GeneWay Biotech, San Diego, CA); purified pelleted diet (Test Diet, Division of Land O’Lakes Purina Feed, LLC, Richmond, IN). Total cholesterol, high-density lipoprotein cholesterol (HDL-C) and triglyceride were used with the commercially available kits (Pointe Scientific, Canton, MI).
Animals and experimental design
Tissue evaluated in this study was from four of the five experimental groups from a previously reported experiment ( 13 ). These four groups were comparable in that each was meal fed specific amounts of diet and the amount eaten was quantified; whereas, the excluded group was fed ad libitum . Briefly, female Sprague Dawley rats were obtained (Charles River, Wilmington, MA) at 20 days of age. At 21 days of age, rats were injected with 50mg N -methyl- N -nitrosourea/kg body weight, intraperitoneally, as described previously ( 14 ). The relevance of this model to the human disease has been reviewed extensively ( 15–21 ). Rats were individually housed in solid-bottomed polycarbonate cages equipped with a motorized running wheel and food delivery system. At 28 days of age, 1 week after carcinogen injection, rats were assigned by stratified randomization using body weight to one of four groups (30 rats/group): (i) meal fed, sham control (CTL); (ii) calorie restricted to 85% of the sham control group (dietary energy restriction, DER); (iii) voluntary running in a motorized activity wheel to a maximum of 1750 m/day (wheel running low, WRL) and (iv) voluntary running in motorized activity wheel to a maximum of 3500 m/day (wheel running high, WRH). In both voluntary running groups, caloric intake was adjusted to deliver the same amount of available energy allocated to rats in the sedentary, restricted calorie (85%) group. The rats ran at a constant speed (37 m/min) and the running wheel was stopped by an autobrake when running revolution reached either 1750 m/day or 3500 m/day or when the 12h allotted time to run was reached ( 13 ).
Rats were fed a purified pelleted diet that is a modification of AIN-76A (Test Diet, Division of Land O’Lakes Purina Feed, LLC, Richmond, IN). Food pellets were distributed based on distance run as a positive reinforcement of running behavior. A computer device attached to the activity wheel monitored distance run and pellets delivered, which were recorded daily. Throughout the experiment, rats were weighed daily and palpated twice weekly for the detection of mammary tumors. At necropsy, rats were skinned and the skin to which mammary gland chains were attached was examined under translucent light for detectable mammary pathologies. All grossly detectable mammary gland pathologies were excised and weighed. A section of the pathologies was fixed in neutral buffered formalin and prepared for histological classification and immunohistochemical analyses; the remainder of each lesion was snap frozen in liquid nitrogen for molecular determination; only confirmed mammary carcinomas are reported since they represented >98% of the pathologies that were observed. Cancer incidence, cancer multiplicity, cancer burden and cancer latency were based on histologically confirmed mammary adenocarcinomas. The experimental protocols were reviewed and approved by the Institutional Animal Care and Use Committee and conducted according to the committee guidelines.
Western blotting
Thirty-two mammary carcinomas (eight per group) were homogenized in lysis buffer [40mM Tris–HCl (pH 7.5), 1% Triton X-100, 0.25M sucrose, 3mM ethylene glycol tetraacetic acid, 3mM ethylene diamine tetraacetic acid, 50 μM β-mercaptoethanol, 1mM phenyl-methylsulfonyl fluoride and complete protease inhibitor cocktail (Calbiochem, San Diego, CA)]. The lysates were centrifuged at 7500 g for 10min at 4ºC and supernatant fractions collected and stored at –80ºC. Supernatant protein concentrations were determined by the Bio-Rad protein assay (Bio-Rad, Hercules, CA). Western blotting was performed as described previously ( 22 ). Briefly, 40 µg of protein lysate per sample was subjected to 8–16% sodium dodecyl sulfate-polyacrylamide gradient gel electrophoresis after being denatured by boiling with sodium dodecyl sulfatesample buffer [63mM Tris–HCl (pH 6.8), 2% sodium dodecyl sulfate, 10% glycerol, 50mM dithiothreitol and 0.01% bromophenol blue] for 5min. After electrophoresis, proteins were transferred to a nitrocellulose membrane. The levels of cyclin D1, p27 Kip1 , Bax/Bcl-2, pLKB Ser428 , LKB, pAMPK Thr172 , AMPK, PI3Kp110, pAkt Ser473 , Akt, TORC1, pRaptor Ser792 , Raptor, pPRAS40 Thr246 , PRAS40, pmTOR Ser2448 , mTOR, pP70S6 Thr389 , P70S6, p4EBP1 Thr37/46 , 4EBP1, pFOXO1 Thr24 , pFoxO3a Thr32 , Forkhead box O (FOXO), SIRT1, growth arrest and DNA damage protein 153 (GADD153), 3-hydroxy-3-methyl-glutaryl-CoA reductase (HMGCR), SREBP1, stearoyl-CoA desaturase 1 (SCD1), pACC Ser79 , acetyl-CoA carboxylase (ACC), fatty acid synthase (FASN) and β-actin were determined using specific primary antibodies, followed by treatment with the appropriate peroxidase-conjugated secondary antibodies and visualized by LumiGLO reagent western blotting detection system. The chemiluminescence signal was captured using a ChemiDoc densitometer (Bio-Rad) that was equipped with a charge-coupled device camera having a resolution of 1300×1030. Quantity One software (Bio-Rad) was used in the analysis. The Quantity One software has a warning algothorim that notifies the user if pixel density is approaching saturation so that all signals used for analysis are in the linear range. All western blot signals were within a range where the signal was linearly related to the mass of protein and actin-normalized scanning density data were used for analysis.
Plasma biomarkers
For the subset of rats on which carcinoma western blots were performed, previously reported plasma ELISA data for the following proteins and hormones were determined: C-reactive protein, serum amyloid P, insulin, insulin growth factor 1, insulin growth factor binding protein 3, adiponectin, leptin, interleukin-6 and tumor necrosis factor-alpha, 17-beta-estradiol and progesterone.
Plasma lipids analysis
Total cholesterol, HDL-C and triglyceride in plasma were determined enzymatically using a commercially available kit. Plasma low-density lipoprotein (LDL-C) cholesterol was calculated using the following formula: LDL cholesterol = total cholesterol – [HDL cholesterol + (triglyceride/5)] using the manufacturer’s directions.
Immunohistochemical staining
Carcinomas evaluated by western blotting were immunohistochemically stained for estrogen and progesterone receptor and Her2/neu The procedure has been described previously ( 23 ).
Statistical analyses
Differences between the control and treatment groups were evaluated as follows: incidence of mammary adenocarcinomas by the Fischer exact text, the number of mammary adenocarcinomas per rat (multiplicity) by analysis of variance after square root transformation of tumor count data, cancer burden and actin-normalized western blot data were evaluated by the non-parametric Kruskal–Wallis test with post hoc unpaired comparisons were using the Dwass–Steel–Chritchlow–Fligner test ( 24 ). Differences among groups in final body weight were analyzed by analysis of variance. Cancer latency was analyzed by survival analysis using the Mantel–Haenszel methods ( 24 ). All analyses were performed using Systat statistical analysis software, version 13 (Systat Software, Chicago, IL). All P values are two-sided and statistical significance was set a priori at P < 0.05.
Soft independent modeling of class analogue (SIMCA) analysis
Our methods have recently been described in detail ( 25 ) and are briefly summarized as follows.
Principal components analysis (PCA).
It is an unsupervised cluster analysis method for summarizing a set of correlated variables by transforming them, by means of an eigen decomposition, into a new set of uncorrelated variables, typically reducing the dimensionality of the original dataset. The procedure is carried out with no prior knowledge of class membership. The first principal component is the linear combination of the features (actin-normalized scanning data from western blotting or ELISA analyses) that passes through the centroid of the full dataset while minimizing the square of the perpendicular distance of each point to that line; each subsequent principal component is constructed in a similar manner, subject to the constraint of being mutually orthogonal ( 26 ).
Orthogonal projections to latent structures for discriminant analysis.
It is a supervised, class-based method where class membership is assigned and used to elicit maximum data separation ( 27 , 28) . The orthogonal projections to latent structures for discriminant analysis (OPLS-DA) is similar to that for the PCA model; however, an additional rotation has been applied using the class information to partition variance into a predictive and an orthogonal component. The number of predictive and orthogonal components in the models was determined by cross-validation. The ability of the model to classify the observations into the defined categories is reflected in misclassification rates for each model, where the target proteins of mammary carcinomas determined by western blotting or plasma ELISA data were classified based on the modeled probability of a single observation belonging to a particular class. All analyses were done using SIMCA-P+ v.12.0.1 (Umetrics, Umea, Sweden).
Results
LEA to 85% of the amount eaten by the control group, in either sedentary rats or in rats that ran an average of 1621±55 (WRL) or 3094±126 (WRH) meters/day (mean ± SEM) inhibited all aspects of the carcinogenic process. Cancer incidence was inhibited by 22% ( P = 0.003), cancer multiplicity was reduced by 36% ( P = 0.006), cancer burden was decreased by 28% ( P = 0.044), whereas cancer latency was prolonged by 6% ( P = 0.010) ( Table I ). However, as previously reported, the differences in the carcinogenic response among the LEA intervention groups, i.e. sedentary, low or high wheel running, were not statistically significant ( 25 ). The animals whose energy availability was limited had final body weights that were on average 90% of the animals in the control group.
Effect of LEA on carcinogenic response in mammary gland, target proteins in mammary carcinomas and plasma lipid profile a,b
| Group | Control | LEA | P Value |
|---|---|---|---|
| Carcinogenic response in mammary gland | |||
| Cancer incidence (%) | 100.0 | 78.0 | 0.003 |
| Cancer multiplicity (no. of carcinomas/rat) | 3.6±0.5 | 2.3±0.2 | 0.006 |
| Cancer burden [cancer mass/rat (g)] | 3.33±0.87 | 2.40±0.42 | 0.04 |
| Cancer latency (day) | 48 (44–51) | 51 (49–53) | 0.01 |
| Final body weight (g) | 249±4 | 224±1 | <0.0001 |
| Cell cycle and apoptosis in mammary carcinomas | |||
| Cyclin D1 | 929±31 | 780±18 | 0.001 |
| p27 | 1002±41 | 1141±29 | 0.019 |
| Bax | 212±7 | 241±8 | 0.033 |
| Bcl-2 | 695±26 | 664±21 | 0.317 |
| Bax/Bcl-2 | 0.31±0.01 | 0.37±0.02 | 0.026 |
| pAkt and SIRT1 in mammary carcinomas | |||
| pAkt Ser473 | 856±55 | 501±22 | <0.0001 |
| SIRT1 | 443±25 | 562±15 | <0.0001 |
| Lipid metabolism in mammary carcinomas | |||
| HMGCR | 540±23 | 469±9 | 0.003 |
| SREBP1 | 396±15 | 294±9 | <0.0001 |
| SCD1 | 224±10 | 215±4 | 0.009 |
| ACC Ser79 ratio | 1.61±0.05 | 1.63±0.03 | 0.794 |
| FASN | 4051±193 | 3550±123 | 0.056 |
| Plasma lipid profile | |||
| Triglyceride (mg/dl) | 79±7 | 64±3 | 0.017 |
| Cholesterol (mg/dl) | 102±4 | 85±2 | <0.0001 |
| HDL-C (mg/dl) | 60±2 | 56±1 | 0.099 |
| LDL-C (mg/dl) | 26±3 | 17±1 | <0.0001 |
| HDL-C/cholesterol (%) | 60±2 | 65±1 | 0.003 |
a Tissue evaluated in this study was from four of the five experimental groups from a previously reported experiment ( 13 ). These four groups were comparable in that each was meal fed specific amounts of diet and the amount eaten was quantified; whereas the excluded group was fed ad libitum .
b Values are means ± SEM for carcinogenic response except incidence and cancer latency (control, n = 30; treatment, n = 90). Final body weight, cancer multiplicity following square root transformation of cancers counts and plasma lipid profile were analyzed by analysis of variance. Cancer incidence was evaluated by Fisher exact test. Cancer burden was evaluated by the Kruskal–Wallis rank test. For cancer latency, which was analyzed by survival analysis using the method of Mantel, the values are means and the numbers in the parentheses are the 95% confidence intervals. For target proteins in mammary carcinomas (control, n = 8; treatment, n = 24), actin-normalized western blot data, which are semiquantitative estimates of protein expression, were analyzed by Kruskal–Wallis rank test. Ratio, the ratio of phospho-protein (arbitrary units of optical density) to non-phospho-protein (arbitrary units of optical density).
The focus of the analyses reported herein was to investigate mechanisms that accounted for the 28% reduction in tumor burden by LEA to the same extent, but with graded increases in physical activity at the same intensity level. The effect on tumor burden was greater than could be accounted for by the effects of these interventions in delaying cancer latency (6%), which would decrease the length of time over which tumors grew. The reported analyses focused on one aspect of cell signaling related to energetics and cancer that associated with mTOR-related signaling as shown in Figure 1 . Because the carcinogenic response did not vary among intervention groups, the experiment provided an opportunity to gain insights about whether varying proportions of physical activity in relation to caloric restriction affected mTOR signaling in tumors by different mechanisms. For this approach, data from LEA intervention groups were initially pooled and subjected to advanced multivariate regression techniques to permit unbiased interrogation of a large body of carcinoma western blot and plasma ELISA data. For factors identified in those analyses to be most influential in distinguishing between the sham control and LEA interventions, more detailed statistical analyses were performed.
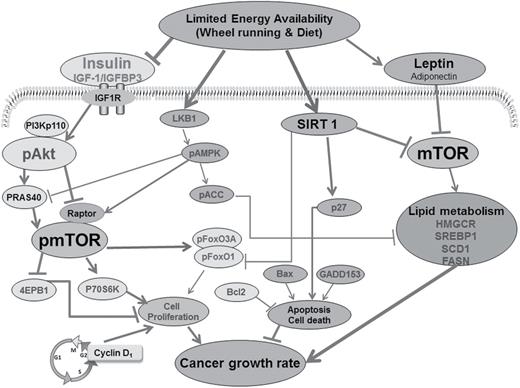
Tissue evaluated in this study was from four of the five experimental groups from a previously reported experiment ( 13 ). These four groups were comparable in that each was fed specific amounts of diet and the amount eaten was quantified; whereas, the excluded group was fed ad libitum . Cellular processes regulating transcription factors, leptin and insulin signaling, energy sensors, and lipid synthesis that are likely to account for the effects on cell proliferation and apoptosis in mammary carcinomas of rats exposed to LEA via wheel running and/or dietary energy restriction versus control. OPLS-DA results indicate prominence of the host systemic regulators (leptin and insulin) and cell autonomous pathways (Akt-mTOR-P70S6K and lipid metabolism), as shown in the yellow cycles, regulated by net energy availability. Decrease of the net energy availability reduces the levels of leptin and insulin and further inactivates mTOR and its downstream factors 70-kDa ribosomal protein S6 kinase (P70S6K) and 4EBP1 via: (i) downregulation of PI3K, phosphorylated Akt, phosphorylated FoxO and phosphorylated 40-kDa proline-rich protein (PRAS40) and (ii) upregulation of phosphorylated liver kinase B1 (pLKB1) and phosphorylated regulatory-associated protein of mTOR (pRaptor). In addition, decrease of the net energy availability reduces HMGCR, SREBP1 and SCD1. Decreased phosphorylated mTOR further attenuate fatty acids synthesis via reduction of HMGCR and SREBP1. Eventually, cancer growth rate is attenuated by reduction in cell proliferation and elevation in apoptotic cell death.
Characteristics of the carcinomas evaluated
For the work reported herein, eight carcinomas from eight different animals were analyzed from each group, i.e. sham control, LEA-sedentary (calorie restricted), LEA-WRL and LEA-WRH, for a total of 32 carcinomas. The carcinomas selected were non-necrotic, sufficiently large for an extended number of analyses and representative of the differences in carcinoma mass and latency in the treatment groups from which they were obtained. All carcinomas were hormone receptor positive, i.e. estrogen and/or progesterone receptor positive and had focal regions of Her2/Neu overexpression, thus representative of luminal breast cancer types A and B ( 29 ). The values for the carcinomas evaluated herein were as follows: carcinoma mass (g), 3.92±0.88, 0.65±0.21, 0.78±0.42, 0.10±0.03 and mean time to detection (day), 41±3, 50±3, 52±3, 55±3, respectively, for the sham control (CTL), LEA-sedentary (DER), LEA-WRL and LEA-WRH. Because we have reported previously that cell proliferation is suppressed and that a proapoptotic environment is induced by LEA via either caloric restriction or increased physical activity ( 8 , 22 , 30) , assessment of these cellular processes was limited to a few key proteins involved in their regulation. As shown in Table I , there were statistically significant effects on proteins involved in both processes with an average reduction in cyclin D1 of 16% ( P = 0.001) and a 14% increase in cyclin-dependent kinase inhibitor p27 ( P = 0.019). The ratio of Bax to Bcl-2, frequently used as a molecular index of apoptosis, was increased 19% ( P = 0.026). Representative western blots and graphs of the protein responses by individual treatment groups are shown in Supplementary Figure S1 , available at Carcinogenesis Online. The detailed comparisons among sham control and the three LEA intervention groups are shown in Supplementary Table S1 , available at Carcinogenesis Online.
Akt-mTOR-LKB1/AMPK regulatory network in carcinomas
To explore whether reducing caloric intake and/or increasing physical activity resulting in the same level of LEA across intervention groups were exerting distinct effects on the signaling pathways shown in Figure 1 and Supplementary Data , protein expression patterns in mammary carcinoma were evaluated using unsupervised and supervised clustering techniques with the goal of determining whether carcinomas could be correctly identified with the treatment group from which they were obtained. As shown in Figure 2 , Panel A, unsupervised cluster analysis using control or LEA intervention (aggregated data from all LEA groups) as the classifier ( y ) and all western blot data from mammary carcinoma as the x variables, tended to separate carcinomas by these designations but separation was poor (see Supplementary Table S2 , available at Carcinogenesis Online for detailed statistics for each regression analysis). However, the OPLS-DA analysis (Panel B), which partitions variance into effects due to treatment and those unrelated to treatment or associated with experimental noise, correctly classified 100% of the carcinomas into the sham control versus the LEA intervention. The graphs shown in Panels A and B and the dendrogram which is Panel C are coded so that the treatment group assignments of each carcinoma that was evaluated can be identified from these data. It is apparent that there is no distinct pattern of clustering of carcinomas by the LEA intervention from which they were selected. As shown in Panels D–F, the variables with the greatest influence in correct classification of carcinomas into sham control versus LEA intervention were elevated pAkt in sham control carcinomas and induction of SIRT1, a protein involved in intracellular energy sensing, in LEA carcinomas. To pursue these findings in greater detail, the pAkt and SIRT1 data were subjected to conventional statistical analyses. There were clear differences in carcinoma levels of pAkt and SIRT1 between the sham control and LEA interventions ( Table I ); however, the differences among LEA interventions were not statistically significant ( Supplementary Table S1 , available at Carcinogenesis Online). Supplementary Table S1 , available at Carcinogenesis Online also shows the effects of LEA on mTOR-related regulatory nodes. These data were subjected to multivariate analysis of variance and evidence was consistent with the overall downregulation of mTOR activity (Hotelling multivariate statistic, P = 0.002).
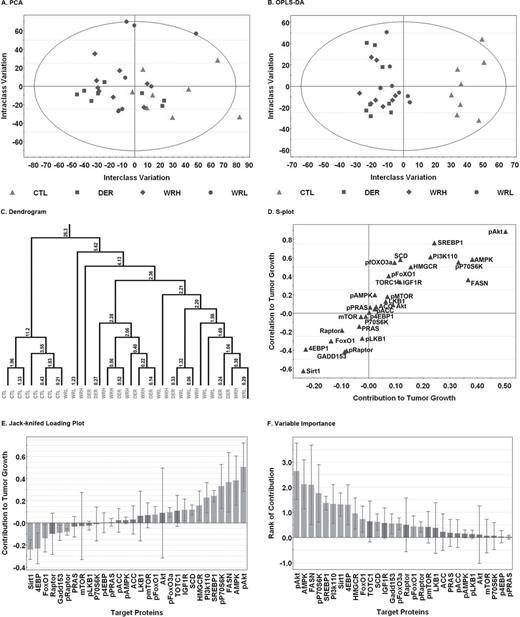
Multivariate discriminant analysis of the actin-normalized intensities for each protein in cellular signaling network that was western blotted was used to examine the correlation structure among proteins and distinguish carcinomas between control (CTL) and treatments including WRH or WRL and DER groups from which they were obtained. Each point represents an individual carcinoma. (Panel A) To visualize inherent clustering patterns, the unsupervised PCA score scatter plot shows the interclass and intraclass variability in protein expression. Only one of 32 observations lie outside the 95% confidence ellipse. (Panel B) OPLS-DA was used to fit a two-class supervised model and partition the sources of variation. The scatter plot shows the first predictive (interclass) and first orthogonal (intraclass) components. Complete separation of the carcinomas from each group was observed, and the wide scatter of carcinomas within group along the y -axis indicates high within-class variation. (Panel C) To visualize the misclassification rate, the dendrogram depicts hierarchical clustering patterns among carcinomas within group. Node height of cluster 5.62 from 0 confirms the elevated diversity seen within the treatment group. To determine the proteins responsible for distinctness of carcinomas in the two groups, the OPLS-DA model was reparameterized to compare control carcinomas to treatment carcinomas. (Panel D) The S-plot shows the relationship between the modeled correlation (vertical axis) and the modeled covariance (horizontal axis) from the two-class OPLS-DA model. Upper right and lower left regions of S-plots contain candidate biomarkers with both high reliability and high magnitude. (Panel E) To determine the statistical reliability of the proteins identified as influential in Panel D, jack-knifed confidence intervals (JKCI) were estimated for the first predictive component for the proteins evaluated and were sorted in ascending order based on expression in the control group; target proteins with JKCI including 0 were indicated by red bars because they are unreliable predictors of treatment group assignment. (Panel F) Rank of importance in target proteins. 4EBP1, eukaryotic translation initiation factor 4E-binding protein 1; ACC, acetyl-CoA carboxylase; Akt, protein kinase B; AMPK, adenosine monophosphate-activated protein kinase; FASN, fatty acid synthase; FoxO, Forkhead box O; GADD153, growth arrest and DNA damage protein 153; HMGCR, 3-hydroxy-3-methyl-glutaryl-CoA reductase; LKB1, liver kinase B; mTOR, mammalian target of rapamycin; P70S6K, 70-kDa ribosomal protein S6 kinase; PI3Kp110, phosphoinositide 3-kinase p110; raptor, regulatory-associated protein of mTOR; PRAS40, 40-kDa proline-rich protein; SCD1, stearoyl-CoA desaturase 1; SIRT1, sirtuin 1; SREBP1, sterol regulatory element-binding protein 1. TORC1, target of rapamycin complex 1.
Plasma analytes
Although the effects of LEA on plasma proteins and steroid hormones have been reported relative to their association with risk for cancer ( 25 ), Figure 3 (detailed statistics for each regression analysis are in Supplementary Table S2 , available at Carcinogenesis Online) shows the plasma data for only those animals in which carcinomas were evaluated by western blot analysis. Good separation of carcinomas by sham control versus LEA intervention was observed in the unsupervised PCA analysis, and complete separation was obtained in the supervised OPLS-DA analysis with the most influential factors in separation being the increased plasma concentrations of leptin and insulin in the sham control group.
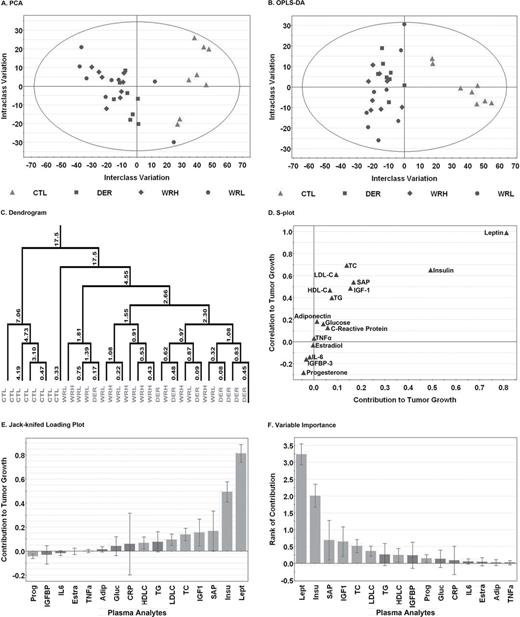
Multivariate discriminant analysis of the plasma analytes was used to examine the correlation structure among plasma biomarkers and distinguish animals between control (CTL) and treatments including WRH or WRL and DER groups from which they were obtained. Each point represents an individual animal. (Panel A) To visualize inherent clustering patterns, the unsupervised PCA score scatter plot shows the interclass and intraclass variability in level of plasma analyte. No observations lie outside the 95% confidence ellipse. (Panel B) OPLS-DA was used to fit a two-class supervised model and partition the sources of variation. The scatter plot shows the first predictive (interclass) and first orthogonal (intraclass) components. Complete separation of the animals from each group was observed, and the wide scatter of animals within group along the y -axis indicates high within-class variation. (Panel C) To visualize the misclassification rate, the dendrogram depicts hierarchical clustering patterns among plasma analytes within group. Node height of cluster 17.5 from 0 confirms the elevated diversity seen within the treatment group. To determine the plasma analytes responsible for distinctness of animals in the two groups, the OPLS-DA model was reparameterized to compare all control animals to all treatment animals. (Panel D) The S-plot shows the relationship between the modeled correlation (vertical axis) and the modeled covariance (horizontal axis) from the two-class OPLS-DA model. Upper right and lower left regions of S-plots contain candidate biomarkers with both high reliability and high magnitude. (Panel E) To determine the statistical reliability of the plasma analytes identified as influential in Panel D, JKCI were estimated for the first predictive component for the plasma analytes evaluated and were sorted in ascending order based on the level in the control group; plasma analytes with JKCI including 0 were indicated by red bars because they are unreliable predictors of treatment group assignment. (Panel F) Rank of importance in plasma analytes. Adip, adiponectin; CRP, C-reactive protein; Estra, estradiol; Gluc, glucose; HDL-C, high-density lipoprotein cholesterol; IGF1, insulin-like growth factor 1; IGFBP, insulin-like growth factor binding protein 3; IL-6, Interleukin-6; Insu, insulin; Lept, leptin; LDL-C, low-density lipoprotein cholesterol; Prog, progesterone; SAP, serum amyloid P; TC, total cholesterol; TG, triglyceride; TNFα, tumor necrosis factor-alpha.
Relationships between plasma and carcinomas
Because an objective of this study was to identify linkages among carcinoma growth, pathway signaling in the carcinomas and alterations in plasma protein and hormone concentrations induced by LEA, a series of regression analyses were performed using the two most influential factors in plasma and carcinoma. As shown in Figure 4 , there was a significant relationship between circulating insulin and levels of pAkt in carcinomas ( r = 0.613, P = 0.0002, Figure 4 , Panel A). There was also a strong association between plasma leptin and carcinoma pAkt ( r = 0.799, P < 0.0001, Figure 4 , Panel B). However, when these regressions were limited to carcinomas from the LEA intervention groups, only the relationship between insulin and pAkt remained statistically significant ( Supplementary Figure S3 , available at Carcinogenesis Online). Of interest was when levels of pAkt in all treatment groups were regressed on predictors of cell proliferation and apoptosis, strong associations were noted. Phosphorylated Akt was inversely associated with the Bax/Bcl-2 ratio as a reflection of apoptotic potential ( r = –0.430, P = 0.014, Figure 4 , Panel C) and the cyclin D1/p27 ratio as a reflection of cell proliferation potential ( r = 0.699, P < 0.0001, Figure 4 , Panel D), effects that were weaker but still observed when the analysis was limited to the LEA groups ( Supplementary Figure S3 , available at Carcinogenesis Online).
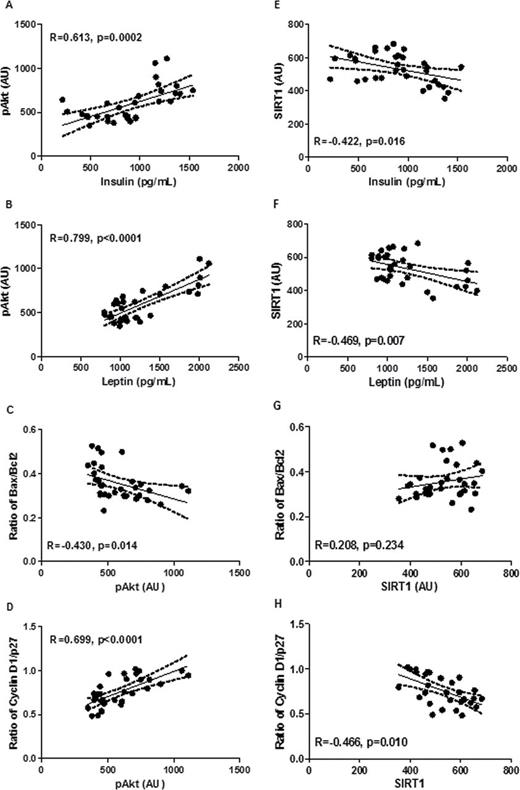
Regression analyses are shown for levels of pAkt in mammary carcinomas on circulating insulin (Panel A) ; levels of pAkt in mammary carcinomas on circulating leptin (Panel B) ; the Bax/Bcl2 ratio as a reflection of apoptotic potential on pAkt in mammary carcinomas (Panel C) ; the Cyclin D1/p27 ratio in mammary carcinomas on levels of pAkt (Panel D) ; levels of SIRT1 in mammary carcinomas on circulating insulin (Panel E) ; levels of SIRT1 in mammary carcinomas on circulating leptin (Panel F) ; the Bax/Bcl2 ratio in mammary carcinomas on levels of SIRT1 (Panel G) ; the cyclin D1/p27 ratio in mammary carcinomas on levels of SIRT1 (Panel H) . Data from all groups were used (sham control and three LEA intervention groups, n = 32). AU, arbitrary unit.
The relationship between plasma insulin and leptin was also examined. There was a negative relationship between circulating insulin and levels of SIRT1 in carcinomas ( r = –0.422, P = 0.016, Figure 4 , Panel E). There was also a negative association between plasma leptin and carcinoma SIRT1 ( r = –0.469, P = 0.007, Figure 4 , Panel B). However, when these regressions were limited to carcinomas from the LEA intervention groups, these relationships were no longer statistically significant ( Supplementary Figure S3 , available at Carcinogenesis Online). When levels of SIRT1 in all treatment groups were regressed on predictors of cell proliferation and apoptosis, SIRT1 was not associated with the Bax/Bcl-2 ratio ( Figure 4 , Panel G) but was negatively associated with the cyclin D1/p27 ratio as a reflection of cell proliferation potential ( r = –0.466, P = 0.010, Figure 4 , Panel H). These effects were not significant when the analysis was limited to the LEA groups ( Supplementary Figure S3 , available at Carcinogenesis Online).
Lipid metabolism
A predicted consequence of the upregulation or downregulation of mTOR-related signaling are changes in lipid synthesis and degradation. Analyses reported herein focused on protein regulators of lipid synthesis that were measured in carcinomas and on the profile of plasma lipids typically measured as indicators of cardiovascular disease risk. These data were included in the analyses reported in Figures 2 and 3 , but the detailed results are shown in Table I . Multivariate analysis of these data indicated was consistent with an overall downregulation of proteins involved in the regulation of lipid synthesis (Hotelling statistic, P < 0.001). In carcinoma, HMGCR, SREBP1 and SCD1 were significantly reduced 13.1% ( P = 0.003), 25.8% ( P < 0.0001) and 11.9% ( P = 0.009), and 12.3% reduction of FASN, P = 0.046, respectively, whereas the effects of LEA activated ACC Ser79 was not statistically significant. Representative western blots and detailed effects of each intervention group are shown in Supplementary Figure S4 and Supplementary Table S1 , available at Carcinogenesis Online. The effects of LEA on plasma lipid profiles are shown in Table I . Plasma total triglyceride, total cholesterol and LDL-C were reduced by LEA by 19.0% ( P = 0.017), 17.7% ( P < 0.001) and 34.6% ( P < 0.0001), respectively; whereas HDL-C/cholesterol was increased 8.3% ( P = 0.003). The detailed responses by intervention groups is shown in Supplementary Table S1 , available at Carcinogenesis Online.
Discussion
In this study, we report that mTOR-related signaling is downregulated in mammary carcinomas by LEA, that multiple regulatory nodes in the mTOR network are involved, and that effects on levels of phosphorylated Akt and Sirt1 are most prominent. Although plasma insulin and leptin were influential in distinguishing between animals in the sham control and LEA interventions, plasma insulin had a stronger association with changes in mTOR pathway regulation mediated via pAkt in the LEA intervention groups. Consistent with reduced mTOR activity, the levels of proteins involved in regulating lipid biosynthesis in the carcinomas were decreased and plasma lipids were reduced in the LEA intervention groups. These findings are highly relevant in light of the fact that mTOR-related signaling is deregulated in the majority of human breast cancers ( 9–12 ) and the upregulation of lipid synthesis is widely observed in breast carcinomas( 31 ). Specific aspects of these findings are discussed in greater detail in the following paragraphs.
Activated protein kinase B
As shown in Figure 2 , an unbiased interrogation of western blot data from carcinomas indicated that high levels of pAkt were influential in distinguishing carcinomas from the sham control versus those from the LEA intervention. Furthermore, a strong association was observed between pAkt and indices of apoptosis and proliferation potential. These findings are consistent with the known role of pAkt in promoting cell proliferation and cell survival, effects mediated in part through pAkt’s regulation of mTOR activity ( 32 ). However, given that the relationship between pAkt and indicators of cell proliferation and apoptosis was stronger than for other regulators of mTOR activity such as S6 kinase and eukaryotic translation initiation factor 4E-binding protein 1 (4EBP1), the data are consistent with the fact that pAkt exerts effects on other regulatory pathways that are independent of mTOR signaling and that also exert effects on cell proliferation and/or cell death ( 33 , 34) .
The biological plausibility of LEA mediating effects on tumor growth via effects on plasma analytes was assessed via regression analyses between carcinoma levels of pAkt and plasma insulin or leptin. A strong association was observed for insulin and leptin when all carcinomas were considered, but the association between pAkt and leptin became non-significant when the analyses were limited to the LEA intervention groups; whereas the relation between insulin and pAkt remained significant. These findings are consistent with a causal link between LEA, insulin, carcinoma pAkt and the processes of cell proliferation and apoptosis that regulate tumor cell growth.
Sirtuin 1
Limiting the net energy available to an organism, rodent or human, has powerful effects in reducing tumor growth. However, it remains unclear if LEA exerts direct effects on energy metabolism in peripheral tissues and in tumors, or if the effects are limited to indirect effects mediated by circulating factors such as insulin ( 35 ). The data shown in Table I and Figures 3 and 4 are certainly consistent with the importance of plasma-borne factors playing an important role. However, inspection of Figure 2 , Panels D and E, provides evidence of SIRT1 induction in response to LEA. It is well recognized that SIRT1 is a component of the intracellular energy sensing apparatus and is induced as the ratio of NAD to NADH increases ( 36 ). The induction of SIRT1 implies that intracellular energy sensing is perturbed even at the modest level of LEA that was investigated ( 37 , 38) . The fact that SIRT1 was induced to a greater extent than AMPK activation may reflect greater demands for NADH and NADPH than ATP to support tumor growth or that other as yet unidentified factors are involved in SIRT1 induction. It is noteworthy that there is a strong negative relationship between plasma leptin and carcinoma levels of SIRT1 ( r = –0.47, P = 0.007), consistent with LEA exerting effects on intracellular energy status within carcinomas, an effect that may be conditional, i.e. induced by demands on energy substrates for biosynthetic processes within the tumor ( 39 ).
Lipid metabolism
Given the known effects of mTOR regulation on lipid metabolism ( 40 ), key regulators of lipid synthesis were assessed ( 10 , 40) . As shown in Table I , the levels of HMGCR, SCD1 and SREBP1 were reduced in carcinomas from LEA rats, effects consistent with both suppressed Akt activation and reduced mTOR activity. Levels of the proteins involved in regulating lipid metabolism were correlated as pAkt > Sirt1 > activated AMPK, consistent with the involvement of both extracellular and intracellular factors in modulating lipid metabolism. The importance of de novo lipid biosynthesis as a limiting factor for tumor growth is receiving increasing attention and the potential role of LEA in limiting intratumoral lipid biosynthesis merits scrutiny ( 41 , 42) . In future studies, both measures of enzyme activity of proteins involved in lipid synthesis and gas chromatography or liquid chromatography time-of-flight mass spectrometry of tissue lipid profiles are required to confirm effects on the biosynthetic process. Nonetheless, the data shown in Table I and Supplementary Table S1 , available at Carcinogenesis Online, suggest an element of mechanism about the role of LEA in limiting tumor growth that is generally unappreciated.
The findings on plasma lipid metabolites reported in Table I indicate that the effects of LEA on lipid metabolism were not limited to the carcinomas investigated. Systemic effects on lipid metabolism have been reported to alter tumor growth and progression ( 43–46 ). Although controversial, both epidemiological studies and laboratory investigations indicate that circulating levels of cholesterol, LDL-C and HDL-C play a role in tumor development, tumor growth and/or tumor aggressiveness as summarized in ref. 47 . In this regard, if causality is ultimately demonstrated, activities that limit availability of cholesterol and reduce the activity associated with cholesterol lipoprotein function would be considered protective against cancer.
Implications for cancer prevention
The excess weight for height characteristic of the global obesity epidemic and the prominence of individuals undergoing weight loss only to have weight gain recur has prompted the search for energy restriction and physical activity mimetic agents ( 48–51 ). It is remarkable that the same pathways affected by LEA are among the regulatory nodes being targeted in the development of these mimetic agents. This offers the promise of reinforcing pharmacological strategies for cancer prevention with appropriate lifestyle interventions. An excellent example of this can be seen in the management of type-2 diabetes using lifestyle interventions, diet and physical activity, in combination with drugs such as metformin. In this regard, the current interest in metformin for the prevention and control of cancer at a number of organ sites including the breast is noteworthy ( 52 ).
Limitations
Although more extreme conditions of reduced caloric intake or physical activity or exercise could have been investigated, the design of this study and the focus on a modest level of limitation in energy availability is meaningful in the translational context. Nonetheless, it is important to underscore that findings about the involvement of cellular and molecular pathways are likely to vary when magnitude of dietary energy restriction or type and amount of physical activity or exercise are increased.
Translational impact/significance
Emerging evidence indicates that the obesity epidemic could be stopped if individuals with body weight within the normal range for height made lifestyle choices that limited their net daily energy availability by 3–15% ( 53 ). When viewed through the lens of factors that affect tumor burden, and at the modest level of LEA required to halt the obesity epidemic, no evidence was found to indicate that the proportion of caloric restriction relative to physical activity energy expenditure differentially affected tumor growth. This finding supports the public health recommendation to maintain body weight within the normal range for height. It appears that this is done by controlling caloric intake and that leading a physically active lifestyle affords the opportunity to maintain weight while increasing caloric intake. Whether types and amounts of physical activity can be identified that differ from those reported herein and that can exert effects on the carcinogenic process independent of factors involved in maintaining body weight in the normal range for height is an ongoing area of inquiry.
Supplementary material
Supplementary Tables S1 and S2 and Figures S1–S4 can be found at Supplementary Data
Funding
United States Public Health Services Grant CA100693 from the National Cancer Institute.
Acknowledgements
The authors thank Jarrod Zacher and Elizabeth Neil for their expert technical assistance and John N.McGinley for immunohistochemical staining.
Conflict of Interest Statement : None.
References
Abbreviations:
- 4EBP1
eukaryotic translation initiation factor 4E-binding protein 1
- ACC
acetyl-CoA carboxylase
- Akt
protein kinase B
- AMPK
adenosine monophosphate-activated protein kinase
- Bax/
Bcl (B-cell lymphoma)-associated X
- Bcl
B-cell leukemia oncogene
- CCD
charge-coupled device
- DER
dietary energy restriction
- FASN
fatty acid synthase
- FoxO
Forkhead box O
- GADD153
growth arrest and DNA damage protein 153
- HDL-C
high-density lipoprotein cholesterol
- HMGCR
3-hydroxy-3-methyl-glutaryl-CoA reductase
- Kip1
kinesin-like protein 1
- JKCI
jack-knifed confidence intervals
- LDL-C
low-density lipoprotein cholesterol
- LEA
limiting energy availability
- LKB1
liver kinase B
- mTOR
mammalian target of rapamycin
- OPLS
orthogonal partial least-squares regression to latent structures
- OPLD-DA
orthogonal projections to latent structures-discriminant analysis
- P70S6K
70-kDa ribosomal protein S6 kinase
- PCA
principal components analysis
- PI3Kp110
phosphoinositide 3-kinase p110
- Raptor
regulatory-associated protein of mTOR
- PRAS40
40-kDa proline-rich protein
- SCD1
stearoyl-coA desaturase 1
- SIRT1
sirtuin 1
- SREBP1
sterol regulatory element-binding protein 1
- TORC1
target of rapamycin complex 1
- WRH
wheel running high
- WRL
wheel running low
