


Abstract
Fas-associated phosphatase-1 is encoded by the protein tyrosine phosphatase, non-receptor type 13 ( PTPN13 ) gene and attributes to the resistance to Fas-mediated apoptosis in several tumors, including squamous cell carcinoma of the head and neck (SCCHN). However, no epidemiological studies have investigated the roles of PTPN13 polymorphisms in SCCHN risk. In this hospital-based case–control study of 1069 SCCHN patients and 1102 non-Hispanic white cancer-free controls, we evaluated the associations between three single-nucleotide polymorphisms c.4068 T>G F1356L (rs10033029), c.4566 A>G I1522M (rs2230600) and c.6241 T>G Y2081D (rs989902) located in the coding region of PTPN13 and SCCHN risk. We found that a significantly increased SCCHN risk was associated with the c.4566 I1522M GG genotype [odds ratio (OR), 1.89; 95% confidence interval (CI), 1.27–2.79] and c.6241 Y2081D GT genotype (OR, 1.26; 95% CI, 1.03–1.53) compared with the c.4566 I1522M AA and c.6241 Y2081D TT genotypes, respectively. Further stratified analyses showed that risk associated with the c.4566 I1522M GG genotype was more profound in the subgroups of young (≤57 years), males, never smokers, current drinkers and patients with pharyngeal cancer; that risk associated with c.6241 Y2081D GT genotype persisted in subgroups of old (>57 years), males, current drinkers and patients with pharyngeal and laryngeal cancers and that risk associated with c.6241 Y2081D GG genotype was borderline in patients with laryngeal cancer. In conclusion, polymorphisms in the PTPN13 coding region may be biomarkers for susceptibility to SCCHN in USA populations.
Introduction
Squamous cell carcinoma of the head and neck (SCCHN) is one of the common malignancies in the USA, accounting for ∼3.2% of newly diagnosed cancer cases in 2009, with the estimated 48 010 new cases and 11 260 deaths ( 1 ). While the history of tobacco and alcohol use remains to be the main risk factors, many studies suggested that genetic predisposition may play an important role in the etiology of SCCHN ( 2 , 3 ). Indeed, our previous studies have suggested that polymorphisms in genes involved in cell cycle regulation, DNA repair and apoptosis were associated with the risk of SCCHN ( 4–7 ).
Apoptosis is a programmed cell death that ensures normal cell homeostasis, and resistance to apoptosis is one of the main characters of many tumors. The apoptosis processes can be divided into two categories: extrinsic and intrinsic (or mitochondrial) apoptosis pathways. Typically, the extrinsic apoptosis pathway is induced by binding of external cell death signals to the tumor necrosis factor receptor superfamily of death receptors. Among all death receptors, Fas/CD95 is the most frequently studied one. Binding of Fas ligand (FasL) to Fas triggers the recruitment of Fas-associated death domain, pro-caspase 8 and pro-caspase 10 to form the death-inducing signaling complex, which then leads to the activation of caspase 8 and caspase 10, the initiators of apoptosis. The activated caspase 8 and caspase 10 cleave effector caspases (e.g. caspase 3, caspase 6 and caspase 7) and then trigger apoptosis. Fas apoptosis signaling has also been suggested to be involved in activation of the mitochondrial death-signaling pathway through induction of cytochrome c release ( 8 ). Although Fas and FasL are normally expressed in many tumors, such as pancreatic adenocarcinoma, hepatocellular carcinoma and colon adenocarcinoma, these tumors are resistant to Fas-mediated apoptosis, suggesting an inhibitory mechanism of Fas signaling existed in tumors ( 9–11 ). Further studies showed that high expression of Fas-associated phosphatase-1 (FAP-1) might attribute to inhibition of the Fas-mediated apoptosis in these tumors ( 10–12 ).
FAP-1 is a 270 kDa non-transmembrane protein encoded by the PTPN13 gene (protein tyrosine phosphatase, non-receptor type 13 gene, also known as PTPL1—protein tyrosine phosphatase 1 or FAP-1 gene) ( 8 ). FAP-1 interacts with the C-terminus of Fas through its PDZ domain and reduces the membrane localization of Fas, therefore inhibiting the Fas-mediated apoptosis, possibly through the dephosphorylation of Fas by FAP-1 ( 13–15 ). FAP-1 is highly expressed in various apoptosis-resistant tumor cells, including SCCHN ( 9–11 , 16 , 17 ). For example, studies showed that human SCCHN cells expressed Fas and FasL were resistant to the Fas-mediated apoptosis, that FAP-1 overexpression correlated with the downregulation of cell surface Fas in SCCHN cells and that FAP-1 induced the resistance of these cells to the Fas-mediated apoptosis through the activation of nuclear factor-kappaB ( 17 , 18 ). Moreover, increased FAP-1 expression was reported to be associated with the tumor progression toward malignancy during oral carcinogenesis ( 19 ), and inhibition of FAP-1 by Etodolac, a selective cyclo-oxygenase-2 inhibitor, has been shown to enhance carboplatin-induced apoptosis of human tongue carcinoma cells ( 20 ). These findings suggested that FAP-1 overexpression is correlated with the progressive tumor growth possibly due to the inhibition of Fas-mediated apoptosis in SCCHN cells, implying an important role of FAP-1 in the development of SCCHN.
The PTPN13 gene is located on chromosome 4q21.3 with 48 exons. This gene reportedly has 865 variants (as of October, 2009; http://www.ncbi.nlm.nih.gov/projects/SNP/ ), but most of which are either extremely rare or non-detectable in the general population. There are only four common (minor allele frequency ≥ 0.05) and potentially functional single-nucleotide polymorphisms (SNPs) (rs10033029, rs2230600, rs12500797 and rs989902) because they are all in the exons and cause amino acid changes. Some studies suggested that the PTPN13 polymorphisms may be associated with predisposition to cancer risk. Although the function of FAP-1 has been well studied, only few published association studies have evaluated the roles of genetic polymorphisms of the PTPN13 gene on cancer risk, in which the PTPN13 cSNP6304 (rs989902) GG genotype was found to be associated with significantly increased risk of hepatocellular carcinomas ( 21 ). To date, no published study has investigated the association between PTPN13 polymorphisms and SCCHN risk. In the current study, we hypothesize that PTPN13 polymorphisms are associated with risk of SCCHN. To test this hypothesis, we genotyped three functional polymorphisms in the PTPN13 coding regions [c.4068 T>G F1356L (rs10033029), which is in linkage disequilibrium with c.4873 G>A E1625K (rs12500797), c.4566 A>G I1522M (rs2230600) and c.6241 T>G Y2081D (rs989902)] and evaluated their associations with SCCHN risk in a non-Hispanic white population.
Materials and methods
Study subjects
The study population included 1069 patients with newly diagnosed SCCHN (i.e. cancers of the oral cavity, oropharynx, hypopharynx and larynx) at The University of Texas MD Anderson Cancer Center between October 1999 and October 2007 and 1102 cancer-free controls recruited during the same period. The patients with second primary tumors, primary tumors of nasopharynx or sinonasal tract or any histopathologic diagnoses other than SCCHN were excluded. The cancer-free controls were recruited from the visitors accompanying patients to clinics and were not genetically related to the patients. The cancer-free controls were frequency matched to cases by age (±5 years) and sex. The response rate for SCCHN patients and cancer-free controls were ∼93 and 85%, respectively. Having signed a written informed consent, the subjects were interviewed to obtain data on age, sex, ethnicity and the history of tobacco and alcohol use. Each subject donated 30 ml venous blood that was used for biomarker assays, including DNA extraction for genotyping. The research protocol was approved by the MD Anderson Institutional Review Board.
Genotyping of PTPN13
The SNPlex assays were used to genotype three PTPN13 SNPs [c.4068 T>G F1356L (rs10033029), c.4566 A>G I1522M (rs2230600) and c.6241 T>G Y2081D (rs989902)] in the DNA Core Lab at MD Anderson Cancer Center, according to the protocol of manufacturer (Applied Biosystems, Foster City, CA). However, the SNP c.6241 T>G Y2081D (rs989902) failed in SNPlex assays and was then genotyped by the restriction fragment length polymorphism (RFLP)–polymerase chain reaction (PCR) method. The data generated by SNPlex assays were analyzed in GeneMapper software (Applied Biosystems) to determine the genotypes. The samples failed to be genotyped in SNPlex assays were also re-evaluated with RFLP. The primers we used in RFLP for three SNPs were c.4068 T>G F1356L (forward) 5′-AGGCTTAGGAGGTGATGGAG-3′ and (reverse) 5′-TGACTCTAACAAGAAATCTTTGTTTG-3′; c.4566 A>G I1522M (forward) 5′-TTTTCTCGAGAAGATAATCTTGT-3′ and (reverse) 5′-TCAAGATAACATCTCCTACATCA-3′ and c.6241 T>G Y2081D (forward) 5′-TCACGTACCTGGACCACAGGAGT-3′ and (reverse) 5′-TCCCAAGAAGCTGAAGTTATCCAGTC-3′. The PCRs were performed by 35 cycles with an annealing temperature of 53°C (c.4068 T>G F1356L), 48°C (c.4566 A>G I1522M) and 62°C (c.6241 T>G Y2081D), respectively. For c.4068 T>G F1356L, the 113 bp PCR products were digested with Bsma I (New England Biolabs, Beverly, MA) at 55°C overnight, the G allele generated 91 and 22 bp bands, whereas T allele remained uncut; for c.4566 A>G I1522M, the 123 bp PCR products were digested with Rsa I (New England Biolabs) at 37°C overnight, the G allele was uncut and the A allele was cut into 101 and 22 bp bands; for c.6241 T>G Y2081D, the 121 bp PCR products were digested with Bsma I at 55°C overnight (New England Biolabs), the T allele produced 78 and 33 bp bands and G allele was cut into 51, 33 and 27 bp bands. For all three SNPs, ∼10% of the samples were random selected and repeated with RFLP, and the error rate was <1%. Those samples with inconsistent genotype results were excluded from the final analysis.
Statistical analysis
All data were analyzed with SAS statistical software program (SAS/STAT version 9.1.3; SAS Institute Inc., Cary, NC). The chi-square tests were used to evaluate the differences in the frequency distributions of categorical variables, including demographic characteristics, tobacco smoking, alcohol use, and alleles and genotypes of PTPN13 polymorphisms between the cases and controls. The associations between PTPN13 polymorphisms and SCCHN risk were evaluated with unconditional univariate and multivariate logistic regression analyses through the estimation of odds ratios (ORs) and 95% confidence intervals (CIs) with or without adjustment for age, sex, smoking and drinking status. The associations of genotypes with SCCHN risk in subgroups were also assessed by stratification analysis by age, sex, smoking status, alcohol use and tumor sites. Homogeneity of ORs between different strata was tested as described previously ( 22 ) followed by analyses of gene–gene and gene–environment interactions, which were evaluated with the P value for the product of two variables of interest in multivariate logistic regression model with adjustment for age, sex, smoking and drinking status. Haplotypes for the PTPN13 polymorphisms were constructed according to the PHASE program ( 23 , 24 ). In brief, each subject was assigned a pair of haplotypes with the highest estimated probabilities. The haplotype frequencies of <5% were combined into one group representing all rare haplotypes, and the haplotype with the highest frequency in the controls was used as the reference group for comparisons. Pearson’s chi-square test was used to test for the difference in haplotypes distributions between cases and controls. Diplotype analysis was conducted in a similar manner, with the assignment of a pair of haplotypes as a diplotype for each subject. All tests were two sided and P < 0.05 was considered significant.
Results
In the present study, the 1069 cases and 1102 controls of non-Hispanic whites were well matched by age and sex ( P = 0.567 and 0.652, respectively) ( Table I ). The mean ages were 57.1 ± 11.1 (age range 18–90) for cases and 56.8 ± 11.1 (age range 20–87) for controls. There were more males in both cases and controls. The cases, compared with the controls, had more smokers (current smokers 37.9 versus 14.5% and former smokers 34.1 versus 36.8%) and more drinkers (current drinkers 50.8 versus 40.2% and former drinkers 21.7 versus 16.0%) ( P < 0.001 for both smoking and drinking status). Smoking or drinking status appeared to be a risk factor for SCCHN in our study population. Therefore, these two variables were adjusted in the subsequent multivariate logistic regression analyses.
Demographic characteristics of SCCHN cases and cancer-free controls
| Variables | Cases n (%) | Controls n (%) | P value a |
| All subjects | 1069 (100.0) | 1102 (100.0) | |
| Age b (years) | |||
| Range | 18–90 | 20–87 | 0.567 |
| Mean | 57.1 ± 11.1 | 56.8 ± 11.1 | |
| ≤57 | 568 (53.1) | 572 (51.9) | |
| >57 | 501 (46.9) | 530 (48.1) | |
| Sex | 0.652 | ||
| Female | 264 (24.7) | 263 (23.9) | |
| Males | 805 (75.3) | 839 (76.1) | |
| Smoking status | <0.001 | ||
| Never | 300 (28.1) | 536 (48.6) | |
| Former | 364 (34.1) | 406 (36.8) | |
| Current | 405 (37.9) | 160 (14.5) | |
| Drinking status | <0.001 | ||
| Never | 294 (27.5) | 483 (43.8) | |
| Former | 232 (21.7) | 176 (16.0) | |
| Current | 543 (50.8) | 443 (40.2) | |
| Tumor site | |||
| Oral cavity | 316 (29.6) | ||
| Pharynx c | 587 (54.9) | ||
| Larynx | 166 (15.5) | ||
Two-sided chi-square test.
The age group was divided by the median age of the controls.
Included both oropharyngeal and hypopharyngeal cancer cases.
According to the single nucleotide polymorphism database from the National Center for Biotechnology Information, there were four common missense polymorphisms located in the coding regions of the PTPN13 gene that had minor allele frequency >5% in Caucasian populations, including c.4068 T>G F1356L (rs10033029), c.4566 A>G I1522M (rs2230600), c.4873 G>A E1625K (rs12500797) and c.6241 T>G Y2081D (rs989902). Among these four polymorphisms, c.4068 T>G F1356L was in linkage disequilibrium with c.4873 G>A E1625K ( r2 = 0.93) according to the HapMap; therefore, c.4873 G>A E1625K was excluded from genotyping in our study. The other three polymorphisms were genotyped by SNPlex assays, followed by RFLP. Figure 1A showed the locations of the SNPs in the gene and RFLP genotyping results of three SNPs. The strong linkage disequilibrium between rs10033029 and rs12500797 was displayed in Figure 1B , as shown by a high r2 value ( r2 = 0.93). The distributions of different genotypes of these three SNPs in control subjects were in agreement with Hardy–Weinberg equilibrium ( P = 0.099 for c.4068 T>G F1356L, 0.078 for c.4566 A>G I1522M and 0.629 for c.6241 T>G Y2081D).
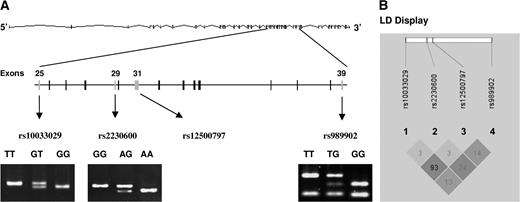
PTPN13 gene structure, genotypes and hyplotypes with the display of four SNPs c.4068 T>G F1356L (rs10033029), c.4566 A>G I1522M (rs2230600), c.4873 G>A E1625K (rs12500797) and c.6241 T>G Y2081D (rs989902). ( A ) PTPN13 gene structure and locations of rs10033029, rs2230600, rs12500797 and rs989902. RFLP genotyping results for rs10033029, rs2230600 and rs989902 were showed as displayed; ( B ) linkage disequilibrium (LD) display for the four SNPs of PTPN13 . The colors were based on D′ and logarithm (base 10) of odds (LOD) values. The dark gray area represented D′ = 1 and LOD ≥ 2, and the light gray area represented D′ < 1 and LOD ≥ 2. The numbers displayed in the diamonds are r2 × 100 for pairwise SNPs.
When the c.4566 A>G I1522M AA genotype was used as the reference, the GG genotype, but not the AG genotype, was associated with a significantly increased risk to SCCHN (adjusted OR, 1.89; 95% CI, 1.27–2.79). When the c.6241 T>G Y2081D TT genotype was used as the reference, a significantly increased risk was associated with the GT genotype (adjusted OR, 1.26; 95% CI, 1.03–1.53) but not with the GG genotype (adjusted OR, 1.00; 95% CI, 0.76–1.30). No significantly altered risk of SCCHN was observed for c.4068 T>G F1356L GT and GG genotypes compared with the TT genotype ( Table II ). Distributions of the minor alleles were statistically different for the c.4566 A>G I1522M G allele ( P =0.007), but not for the 4068 T>G F1356L G allele or c.6241 T>G Y2081D G allele, between cases and controls ( P =0.640 and 0.304, respectively).
Genotyping distribution of PTPN13 SNPs of SCCHN cases and cancer-free controls and their association with SCCHN risk
| SNP position | Cases, n (%) | Controls, n (%) | P value | Crude OR (95% CI) | Adjusted OR (95% CI) a |
| All subjects | 1069 (100.0) | 1102 (100.0) | |||
| c.4068 T>G F1356L (rs10033029) | 0.326 b | ||||
| TT | 815 (76.2) | 857 (77.8) | 1.00 | 1.00 | |
| GT | 239 (22.4) | 223 (20.2) | 1.13 (0.92–1.39) | 1.09 (0.88–1.35) | |
| GG | 15 (1.4) | 22 (2.0) | 0.72 (0.37–1.39) | 0.61 (0.31–1.22) | |
| G allele | 0.126 | 0.121 | 0.640 c | ||
| c.4566 A>G I1522M (rs2230600) | 0.001 b | ||||
| AA | 695 (65.0) | 747 (67.8) | 1.00 | 1.00 | |
| AG | 290 (27.1) | 310 (28.1) | 1.01 (0.83–1.22) | 1.00 (0.82–1.22) | |
| GG | 84 (7.9) | 45 (4.1) | 2.01 (1.38–2.92) | 1.89 (1.27–2.79) | |
| G allele | 0.214 | 0.182 | 0.007 c | ||
| c.6241 T>G Y2081D (rs989902) | 0.014 b | ||||
| TT | 332 (31.1) | 392 (35.6) | 1.00 | 1.00 | |
| GT | 572 (53.5) | 524 (47.6) | 1.29 (1.07–1.56) | 1.26 (1.03–1.53) | |
| GG | 165 (15.4) | 186 (16.9) | 1.05 (0.81–1.35) | 1.00 (0.76–1.30) | |
| G allele | 0.422 | 0.407 | 0.304 c |
Adjusted for age, sex, smoking and drinking status in the logistic regression model.
Distribution of three genotypes.
Test for allele differences between cases and controls.
To determine the contribution of PTPN13 SNPs to SCCHN risk, we also performed haplotypes and diplotypes analyses ( Table III ). Among all eight possible haplotypes we inferred, four had frequencies >5%. The overall distribution of PTPN13 haplotypes was not statistically significant between cases and controls (global test: P = 0.125). The most frequent haplotype T-A-T (in the order of c.4068 T, c.4566 A and c.6241 T) (52.5% in cases and 55.2% in controls) was used as the reference, whereas all the haplotypes <5% were grouped as ‘others’, representing one group of rare haplotypes. We did not find any statistically significantly altered risk associated with any of haplotypes compared with the reference. Similarly, among 23 possible diplotypes, four had a frequency >5%. The overall distribution of PTPN13 diplotypes was not statistically significant ( P = 0.150). Compared with the most frequent diplotype T-A-T/T-A-T (26.2% in cases and 30.7% in controls), the diplotype T-A-T/G-A-G had significantly increased risk only in univariate analysis (OR, 1.40; 95% CI, 1.04–1.90), suggesting the combination of G allele from c.4068 T>G F1356L and G allele from c.6241 T>G Y2081D may contribute to SCCHN risk. However, this risk was reduced to borderline significant after adjustment for age, sex, smoking and drinking status (OR, 1.34; 95% CI, 0.98–1.84), suggesting our study sample size was still not large enough to provide a sufficient study power.
PTPN13 haplotype and diplotype distributions of SCCHN cases and cancer-free controls and their association with SCCHN risk a
| Haplotype | Cases ( n = 2138), chromosome no. (%) | Controls ( n = 2204), chromosome no. (%) | Crude OR (95% CI) | Pb | Adjusted OR (95% CI) c | Pb |
| T-A-T | 1123 (52.5) | 1216 (55.2) | 1.00 | 1.00 | ||
| T-A-G | 311 (14.5) | 332 (15.1) | 1.03 (0.86–1.23) | 0.736 | 1.02 (0.85–1.23) | 0.828 |
| T-G-G | 357 (16.7) | 327 (14.8) | 1.17 (0.98–1.40) | 0.081 | 1.14 (0.95–1.38) | 0.157 |
| G-A-G | 228 (10.7) | 233 (10.6) | 1.05 (0.86–1.30) | 0.620 | 1.00 (0.80–1.24) | 0.973 |
| Others d | 119 (5.6) | 96 (4.4) | 1.27 (0.99–1.64) | 0.063 | 1.23 (0.94–1.61) | 0.132 |
| Diplotype | Cases ( n = 1069), n (%) | Controls ( n = 1102), n (%) | Crude OR (95% CI) | Pb | Adjusted OR (95% CI) c | Pb |
| T-A-T/T-A-T | 280 (26.2) | 338 (30.7) | 1.00 | 1.00 | ||
| T-A-T/T-A-G | 199 (18.6) | 188 (17.1) | 1.26 (0.98–1.63) | 0.072 | 1.25 (0.96–1.64) | 0.101 |
| T-A-T/T-G-G | 192 (18.0) | 191 (17.3) | 1.22 (0.93–1.60) | 0.162 | 1.18 (0.89–1.57) | 0.254 |
| T-A-T/G-A-G | 137 (12.8) | 118 (10.7) | 1.40 (1.04–1.90) | 0.029 | 1.34 (0.98–1.84) | 0.070 |
| Others e | 261 (24.4) | 267 (24.2) | 1.16 (0.91–1.47) | 0.232 | 1.10 (0.86–1.41) | 0.464 |
The P values for chi-square tests were 0.125 for haplotypes and 0.150 for diplotypes frequencies distributions. The haplotypes and diplotypes were based on the order of three SNPs c.4068 T>G F1356L, c.4566 A>G I1522M and c.6241 T>G Y2081D.
Two-sided chi-square tests in logistic regression models.
Adjusted for age, sex, smoking and drinking status in the logistic regression model.
Includes four minor haplotypes, each with a frequency <0.05.
Includes 19 minor diplotypes, each with a frequency <0.05.
We then evaluated the association between PTPN13 variant genotypes and SCCHN risk stratified by age, sex, smoking and drinking status and tumor site. As shown in Table IV , the c.4566 A>G I1522M GG genotype was associated with a significantly increased risk of SCCHN in the subgroups of ≤57 years (OR, 1.96; 95% CI, 1.17–3.28), males (OR = 1.95; 95% CI, 1.24–3.07), never smokers (OR, 2.55; 95% CI, 1.31–4.98), current drinkers (OR, 2.58; 95% CI, 1.30–5.08) and patients with cancer of pharynx (OR, 2.18; 95% CI, 1.41–3.37); the risk for the c.6241 Y2081D GT genotype was more pronounced in the subgroups of >57 years (OR, 1.36; 95% CI, 1.01–1.81), males (OR, 1.31; 95% CI, 1.05–1.65), current drinkers (OR, 1.39 95% CI, 1.03–1.87) and patients with primary tumor sites of pharynx (OR, 1.31; 95% CI, 1.04–1.65) and larynx (OR, 1.63; 95% CI, 1.06–2.51) and the c.6241 Y2081D GG genotype was associated with a borderline risk of laryngeal cancer (OR, 1.71; 95% CI, 1.00–2.90; P = 0.049). These data suggested that risk factors may interact with genotypes of PTPN13 SNPs in the etiology of SCCHN. However, there was no statistical evidence to support such interactions, as evaluated in our multivariate logistic regression model ( Table IV ).
Stratification analysis of the association between PTPN13 SNPs and SCCHN risk
| Variables | c.4566 A>G I1522M | c.6241 T>G Y2081D | ||||
| AA | AG | GG | TT | GT | GG | |
| Age | ||||||
| ≤57 | ||||||
| Cases/controls | 358/388 | 162/158 | 48/26 | 181/195 | 299/276 | 88/101 |
| Adjusted OR (95% CI) b | 1.00 | 1.11 (0.84–1.45) | 1.96 (1.17–3.28) | 1.00 | 1.15 (0.88–1.51) | 0.91 (0.63–1.30) |
| >57 | ||||||
| Cases/controls | 337/359 | 128/152 | 36/19 | 151/197 | 273/248 | 77/85 |
| Adjusted OR (95% CI) b | 1.00 | 0.90 (0.67–1.21) | 1.72 (0.94–3.16) | 1.00 | 1.36 (1.01–1.81) | 1.10 (0.74–1.64) |
| P for interaction a | 0.126 | 0.327 | ||||
| Sex | ||||||
| Female | ||||||
| Cases/controls | 170/191 | 75/60 | 19/12 | 78/87 | 145/134 | 41/42 |
| Adjusted OR (95% CI) b | 1.00 | 1.42 (0.93–2.17) | 1.74 (0.79–3.84) | 1.00 | 1.07 (0.71–1.61) | 1.08 (0.61–1.89) |
| Male | ||||||
| Cases/controls | 525/556 | 215/250 | 65/33 | 254/305 | 427/390 | 124/144 |
| Adjusted OR (95% CI) b | 1.00 | 0.91 (0.72–1.14) | 1.95 (1.24–3.07) | 1.00 | 1.31 (1.05–1.65) | 0.98 (0.72–1.32) |
| P for interaction a | 0.310 | 0.974 | ||||
| Smoking status | ||||||
| Never | ||||||
| Cases/controls | 197/374 | 81/146 | 22/16 | 103/193 | 152/257 | 45/86 |
| Adjusted OR (95% CI) b | 1.00 | 1.05 (0.76–1.45) | 2.55 (1.31–4.98) | 1.00 | 1.10 (0.81–1.51) | 0.99 (0.64–1.52) |
| Former | ||||||
| Cases/controls | 230/262 | 108/125 | 26/19 | 109/143 | 202/195 | 53/68 |
| Adjusted OR (95% CI) b | 1.00 | 0.97 (0.71–1.32) | 1.63 (0.8–3.04) | 1.00 | 1.36 (0.99–1.87) | 1.03 (0.66–1.60) |
| Current | ||||||
| Cases/controls | 268/111 | 101/39 | 36/10 | 120/56 | 218/72 | 67/32 |
| Adjusted OR (95% CI) b | 1.00 | 1.01 (0.64–1.58) | 1.55 (0.73–3.31) | 1.00 | 1.39 (0.90–2.14) | 0.95 (0.55–1.65) |
| P for interaction a | 0.539 | 0.794 | ||||
| Drinking status | ||||||
| Never | ||||||
| Cases/controls | 201/330 | 68/131 | 25/22 | 97/165 | 149/240 | 48/78 |
| Adjusted OR (95% CI) b | 1.00 | 0.88 (0.62–1.24) | 1.76 (0.96–3.23) | 1.00 | 1.02 (0.74–1.42) | 1.05 (0.67–1.63) |
| Former | ||||||
| Cases/controls | 148/116 | 64/50 | 20/10 | 69/69 | 125/76 | 38/31 |
| Adjusted OR (95% CI) b | 1.00 | 1.03 (0.65–1.63) | 1.33 (0.58–3.02) | 1.00 | 1.54 (0.97–2.42) | 1.06 (0.58–1.94) |
| Current | ||||||
| Cases/controls | 346/301 | 158/129 | 39/13 | 166/158 | 298/208 | 79/77 |
| Adjusted OR (95% CI) b | 1.00 | 1.08 (0.80–1.45) | 2.58 (1.30–5.08) | 1.00 | 1.39 (1.03–1.87) | 0.91 (0.60–1.36) |
| P for interaction a | 0.371 | 0.980 | ||||
| Tumor site | ||||||
| Oral cavity | ||||||
| Cases/controls | 220/747 | 76/310 | 20/45 | 108/392 | 170/524 | 38/186 |
| Adjusted OR (95% CI) b | 1.00 | 0.82 (0.60–1.12) | 1.31 (0.73–2.35) | 1.00 | 1.05 (0.78–1.41) | 0.71 (0.46–1.09) |
| Pharynx | ||||||
| Cases/controls | 370/747 | 167/310 | 50/45 | 182/392 | 314/524 | 91/186 |
| Adjusted OR (95% CI) b | 1.00 | 1.08 (0.86–1.36) | 2.18 (1.41–3.37) | 1.00 | 1.31 (1.04–1.65) | 1.03 (0.75–1.41) |
| Larynx | ||||||
| Cases/controls | 105/747 | 47/310 | 14/45 | 42/392 | 88/524 | 36/186 |
| Adjusted OR (95% CI) b | 1.00 | 1.18 (0.79–1.78) | 1.78 (0.87–3.65) | 1.00 | 1.63 (1.06–2.51) | 1.71 (1.00–2.90) |
The interaction P value was obtained from the chi-square test for the product of two variables in multivariate logistic regression model.
Adjusted for age, sex, smoking and drinking status in the logistic regression model.
Discussion
In our current hospital-based case–control study, we investigated the associations between three PTPN13 functional polymorphisms and SCCHN risk. Individually, the c.4566 A>G I1522M GG genotype and the c.6241 T>G Y2081D GT genotype were associated with significantly increased risk of SCCHN. Further stratified analysis confined the risk associated with the c.4566 A>G I1522M GG genotype to subgroups of ≤57 years, males, never smokers, current drinkers and primary tumor site of the pharynx and the risk associated with the c.6241 Y2081D GT genotype to subgroups of >57 years, males, current drinkers and patients with cancers of the pharynx and larynx. To our best knowledge, this is the largest case–control study on the susceptibility of PTPN13 polymorphisms to cancer risk and the first on SCCHN.
PTPN13 encodes FAP-1, which is often overexpressed in multiple cancers and functions to resist Fas-related death signals. Tyrosine phosphorylation of Fas triggered by the treatment of FasL was thought to be the key step in the Fas-mediated apoptosis, and dephosphorylation of phosphor-tyrosine 275 in the carboxyl terminus of Fas by FAP-1 was suggested to be one of the mechanisms underlying the resistance to the Fas-mediated apoptosis by cancer cells ( 14 ). Besides, FAP-1-mediated activation of nuclear factor-kappaB was also suggested to be responsible for the resistance of SCCHN cells to the Fas-mediated apoptosis ( 17 ). Another study found that FAP-1 suppressed apoptosis pathway mediated by common neurotrophin receptor p75, which is a member of tumor necrosis factor receptor superfamily ( 25 ). Taken together, FAP-1 encoded by PTPN13 plays an important role in the resistance of cancer cells to apoptosis. Therefore, it is biologically plausible that the functional polymorphisms in this gene may contribute to the altered functions of FAP-1. However, detailed mechanistic studies on the functions of these observed polymorphisms are needed to unravel the underlying molecular mechanisms.
In the literature, we only found one case–control study of the associations between PTPN13 polymorphisms and cancer risk. In this study of 534 hepatocellular carcinoma cases and 295 control subjects, the PTPN13 c.6241 T>G Y2081D (reported as cSNP6304) GG genotype was shown to be associated with significantly increased risk of multiplex familial hepatocellular carcinomas (OR, 2.67; 95% CI, 1.15–6.17) but not for the GT genotype (OR, 1.17; 95% CI, 0.58–2.40) nor for the c.4566 A>G I1522M (reported as cSNP4629) GG genotype ( 21 ). Interestingly, our much larger study showed the opposite results because we found that the c.4566 A>G I1522M GG genotype and the c.6241 T>G Y2081D GT, but not GG, genotype were associated with significantly altered risk of SCCHN. There are several explanations for these seemingly discrepant results. First, the risk associated with these genotypes may be tissue specific; second, the published study of hepatocellular carcinomas had a very limited sample size, with only 295 controls and 48 multiplex familial hepatocellular carcinoma cases, which may not have enough study power to detect the risks associated with these genotypes; third, the risk associated with PTPN13 variant genotypes differed by age, sex, smoking and drinking status and primary sites of tumors, such a stratification analysis needs a much larger sample size, as we demonstrated in the present study.
In our study population, ∼50% of subjects had the c.6241 T>G Y2081D hererozygous genotype (GT) that was associated with a greater risk of SCCHN than was the homozygous GG genotype. As a result, some of the haplotypes we inferred was associated with a lower risk of SCCHN than individual polymorphisms we examined. One explanation to these results could be heterozygote advantage in the penetration of phenotype, i.e. alleles T and G with different functions could act together to exert stronger phenotype effects. Indeed, heterozygote advantage has been reported to explain the polymorphisms in major histocompatibility complex, as heterozygotes presented two sets of epitopes to T cells and could respond more efficiently to pathogens ( 26–28 ). However, further studies on the underlying molecular mechanisms are needed to determine whether heterozygote advantage does exist for the .6241 T>G Y2081D polymorphism.
In summary, our study indicated that subjects who carried the c.4566 A>G I1522M GG genotype and the c.6241 T>G Y2081D GT genotype had a significantly increased risk of SCCHN. These SNPs cause amino acids change that may lead to the altered function of FAP-1 but may not be reflected by the altered expression level. However, further functional assays addressing amino acid change for its functionality are not readily available. However, the results supported our hypothesis that functional polymorphisms of PTPN13 are associated with SCCHN risk. Considering the large sample size of non-Hispanic whites, this study provides reliable risk estimates. Because of its nature of a hospital-based case–control study, an uncontrolled bias may exist in our selection of participants. Therefore, our results should be further validated by other larger, population-based, preferably prospective studies.
Funding
National Institute of Health (R01 CA131274, R01 ES011740) to Qingyi Wei (P50 CA097007), Scott Lippman; cancer prevention fellowship (R25T CA057730) to Robert Chamberlain and Shine Chang (P30 CA016672); The University of Texas MD Anderson Cancer Center.
Abbreviations
- CI
confidence interval
- FAP-1
Fas-associated phosphatase-1
- FasL
Fas ligand
- OR
odds ratio
- PCR
polymerase chain reaction
- PTPN13
protein tyrosine phosphatase, non-receptor type 13
- RFLP
restriction fragment length polymorphism
- SCCHN
squamous cell carcinoma of the head and neck
- SNP
single-nucleotide polymorphism
We thank Margaret Lung and Kathryn L. Tipton for their assistance in recruiting the subjects and gathering the questionnaire information and Zhensheng Liu, Yawei Qiao, Jianzhong He, Kejing Xu and Min Zhao for laboratory assistance.
Conflict of Interest Statement: None declared.
